Notes on Frequency Response
(Last Modified: 27 November 2010 09:56:32 PM )
Linear electronic circuits can be characterized by their "frequency response" which is a plot of the gain response (and a separate plot of the phase response) of the circuit as a function of frequency. We can categorize circuits based upon the general nature of these response characteristics. Such categories include high pass filters, low pass filters, notch filters, etc, etc, etc.
A very common and important category of response is the bandpass filter. This filter is characterized by a region of frequencies (called the midband) where the gain is constant (or reasonably so) and by decreased gain either above or below the midband. Note that in the context of this discussion no distinction is made between a "filter" and an "amplifier" - in both cases we are merely talking about the gain of the circuit as a function of frequency. Furthermore, we will only focus on the gain of the circuit and not the phase response. This is not to say that phase response is unimportant - it is critically important in many circumstances. Just that we are taking one step at a time and phase response and its implications are not the subject of the present material.
Bandpass Circuits
If we are dealing with a circuit that has a bandpass characteristic - and notice that this condition means that the following treatment is NOT universal - it applies to circuits that have a bandpass characteristic - then we can make the following observations regarding the gain transfer function A(s) = Vout(s)/Vin(s).
- It has to yield a constant value within the midband.
- It must drop off for frequencies above the upper cutoff frequency.
- It must drop off for frequencies below the lower cutoff frequency - though if we relax this constraint then we can deal with filters and amplifiers that operate all the way down to DC.
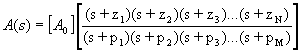
For now, let's assume that we have the mathematical equation for A(s). Namely, that we can write A(s) as follows:
Recall that the variable s is the complex frequency and that, for steady state response:
![]()
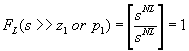
The amplitude response at a particular frequency is simply the magnitude of the transfer function evaluated at that frequency. Let us look at the extreme cases to get our first glimpse of the constraints that apply to A(s) if it is to describe the transfer function of a bandpass circuit.
If the zeros and poles are ordered from lowest frequency to highest frequency and if the frequency is significantly greater than any of the pole or zero frequencies, each factor is approximately equal to s and the overall response is approximately equal to:
If this response is to die off for sufficiently high frequencies, then we notice that the number of poles must be greater than the number of zeros. In other words, M>N. If not, then as s (the complex frequency) increases we eventually have a function that either has constant amplitude or, if M<N, one that grows without bound which would be bad - for any circuit.
The second thing to note is that the zeros are at -z1, -z2, -z3,...-zN and the poles are at -p1,-p2,-p3,...-pM. Don't let this confuse you. These are NOT "real" frequencies - they are COMPLEX frequencies (in the complex frequency domain) that come about by taking the Laplace Transform of the time-domain differential equations that describe the circuit. By taking care in noting the relationships between the time domain equations and the complex frequency domain equations, we can relate parameters in one to parameters in the other without having to go through the actual mathematical gymnastics of taking the Transforms and Inverse Transforms. In particular, we note that a pole at a complex frequency of -p corresponds to a cutoff frequency of p in the "real" world. Therefore, we usually refer to there being a pole at, say, 10kHz when, technically, the pole of the transfer function is at -10kHz. Don't let yourself get too hung up on this technicality.
The next thing to note is that each pole (p1, p2, etc.) and each zero (z1, z2, etc.) represent frequencies at which the behavior of the circuit changes. In particular, the slope of A(s) increases by 20 dB/decade every time a zero is encountered and decreases by 20 dB/decade each time a pole is encountered.
We have stated in condition (1) above that A(s) has a constant value within the midband. This means that there are no poles or zeros within the midband range of frequencies. In theory, you could have a pole and a zero located at the same frequency and their effects would cancel out, but that is almost universally avoided in practical circuits for a host of reasons.
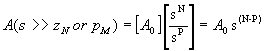
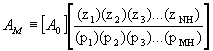
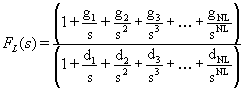
With this in mind, we can categorize each and every pole in A(s) into one of two camps - frequencies that are below the midband and frequencies that are above the midband. Those that are below the midband we group together into one function called FL(s) and those that are above we group together into another function called FH(s). Therefore we can write our overall gain transfer function as:
![]()
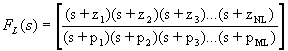
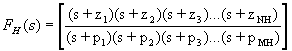
At the same time that we distribute the poles and zeros among the two transfer functions, we will order them such that, in FL(s) the highest frequency pole is p1 and they decrease from there. Conversely, in FH(s) the lowest frequency pole will be p1 and they will increase from there. The zeros are ordered similarly in the two transfer functions - in order of decreasing frequency in FL(s) and increasing frequency in FH(s). As we shall see, this makes p1 the dominant pole in each case. We shall also see that the zeros and poles with higher indices are increasingly insignificant to the behavior of the circuit - at least in the vicinity of the cutoff frequencies.
If we plot FL(s) by itself, it is going to look like a high pass filter response - it HAS to in order to yield a constant response within the midband. What this means is that, above some frequency - which we will call the lower cutoff frequency - it is going to flatten out and stay at a uniform gain from that frequency on up. Using this observation, we can conclude that the number of zeros (NL) and the number of poles (ML) must be equal - otherwise we will have a residual slope within the midband in violation of our primary condition. So we will just use NL for both. We can also inquire as to the high frequency gain of FL(s) by simply applying the approximation that for s much, much greater than any of the pole or zero frequencies in FL(s) that each term is about equal to s. Doing this, we see that:
Similarly, if we plot FH(s) by itself, it is going to look like a low pass filter response - again, it HAS to in order to yield a constant response within the midband. Below some frequency - which we will call the upper cutoff frequency - it is going to flatten out and stay at a uniform gain from that frequency on down. However, unlike FL(s), all we can conclude is that the number of poles is greater than the number of zeros (MH>NH) as this is the only requirement to ensure that the overall response is acceptable as the frequency grows without bound. However, we can still inquire as to the low frequency gain of FH(s) by simply applying the approximation that for s much, much less than any of the pole or zero frequencies in FH(s) that the term is about equal to the pole or zero associated with that term. Doing this, we see that:
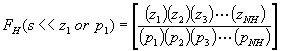
This factor is a constant and we can factor it out of FH(s).
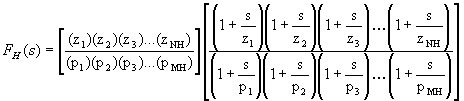
Notice that the if we redefine FH(s) to be just the right hand factor above, we have:
Note that the newly redefined FH(s) has (near) unity gain below the upper cutoff frequency. This, combined with the fact that FL(s) has (near) unity gain above the lower cutoff frequency, means that within the midband, the gain is equal to the product of the factor we removed from FH(s) and A0. We will define this quantity as the midband gain, AM and hence the overall transfer function, A(s), becomes:
![]()
In summary, for a circuit having a bandpass characteristic, the above transfer function has the following traits:
AM is a constant and represents the circuit gain within the pass band.
FL(s) is the normalized low frequency response and is unity above the lower cutoff frequency.
FH(s) is the normalized high frequency response and is unity below the upper cutoff frequency.
The Cutoff Frequencies Defined
As already noted, the midband region is delimited by the upper and lower cutoff frequencies. To be more precise, the respective cutoff frequency is that frequency at which the gain is reduced by an amount sufficient to result in only half of the power being delivered to a purely resistive load as is delivered within the midband where the gain is AM. For this reason, these frequencies are also known as the half-power frequencies.
Recall that the voltage gain of a circuit is given by:
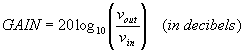
If, for the same Vin, the power delivered to a purely resistive load is reduced by a factor of two, then the gain at the cutoff frequency is:
![]()
In light of the above result - a result you should be comfortable in deriving - the cutoff frequencies, in addition to being referred to as the half-power frequencies, are also commonly called the 3dB frequencies of the circuit.
Finding the Cutoff Frequencies
If you know the poles and zeros (i.e., actually have the mathematical equations as a result of doing a full blown circuit analysis) then you simply set the magnitude of FL(s) to -3dB and solve for the frequency at which this occurs. This will yield the lower cutoff frequency. A similar process with FH(s) will yield the upper cutoff frequency.
Certainly, the entire circuit can be analyzed as a single entity and the resulting transfer function, A(s), examined to determine the desired quantities. However, this analysis is not trivial for anything beyond the simplest of circuits. Fortunately, the analysis can be greatly simplified by exploiting the behavior of AM, FL(s) and FH(s) and noting that changes in the circuit behavior are the result of the presence of reactive elements - namely capacitors and inductors. A purely resistive circuit has a completely flat frequency response. For the circuits we will be working with, we are only interested in the influence of capacitors (both external physical capacitors and internal junction capacitances). We are merely assuming that we have no inductive elements. Unless there are physical inductors present, this is generally a good assumption until very high frequencies (RF and higher) are reached at which point parasitic inductances of the leadwires and internal inductances start to be relevant.
Returning to our case where only capacitors are involved, if we can identity which capacitors participate in which function - the low frequency response or the high frequency response, then we can greatly simplify our analysis task. Each capacitor will participate in one pole or one zero/pole pair. For a given capacitor that produces both a zero and pole, the zero frequency is generally located fairly close to the pole frequency - the point here being that both will either lie in FL(s) or FH(s) as opposed to the pole in one and the zero in the other. This is not guaranteed, however. While it is usually the case it might not be for a particular circuit. However, most circuits are designed so as to ensure that this is the case.
In the case of transistor-based circuits, the very small (pF scale) internal capacitances generally determine the high frequency response while the much larger (uF scale) external capacitors generally determine the low frequency response. Again, this is not guaranteed to be the case and if the external capacitors are on the order of 10nF or less then the internal capacitances, which in certain circuit configurations can behave like capacitors of about this size, may result in poles at lower frequencies than the external capacitors do. However, these circuits generally do not follow the bandpass model that we are assuming as our starting point.
Frequency-Based Equivalent Circuits
Assuming that the above breakdown is valid, then we can draw three separate circuits:
Midband Equivalent Circuit: This approximation exploits that fact that in the midband the circuit is operating at a sufficiently high frequency that the external capacitors look like shorts but also at a sufficiently low frequency that the internal capacitors still look like opens. This circuit is generally pretty straightforward to analyze since it has no poles or zeros and since the opened and shorted capacitors generally result is significant simplifications to the circuit. Furthermore, the assumptions regarding the behavior of the various capacitors are not at all unreasonable since, pretty much by definition, the limits of the midband are determined by the frequencies at which these assumptions begin to fail. Determining what these limiting frequencies are is commonly the primary - and frequently the only - motivation for analyzing the high and low frequency equivalent circuits at all.
Low-Frequency Equivalent Circuit: This approximation is applicable in the low frequency region (frequencies below the midband) and in this region we assume that the internal capacitances have such large reactances that they effectively behave as open circuits. Thus the only poles and zeros that survive the analysis are the low frequency ones associated with the external capacitors. Not only are there fewer poles in the resulting circuit, but the opened internal capacitances can also significantly simplify the analysis of the resulting circuit.
High-Frequency Equivalent Circuit: This approximation is applicable in the high frequency region (frequencies above the midband) and in this region we assume that the external capacitances have such small reactances that they effectively behave as short circuits. Here the only poles and zeros that survive the analysis are the high frequency ones associated with the internal capacitors. As before, not only are there fewer poles in the resulting circuit but the shorted external capacitances can significantly simplify the analysis.
Dominant Poles
Even after using the above technique to break the circuit into three simpler circuits, the analysis can be quite involved - especially for multitransistor circuits. It would be very useful if we could at least get an approximate value for the cutoff frequencies using a simpler and faster technique, especially if the value of the upper and lower cutoff frequencies are all that we are interested in as opposed to wanting to know the detailed behavior of the circuit outside of the midband.
The method of open circuit and short circuit resistances, developed below, provides a means of doing this if the circuit obeys one simple rule - the circuit must have a sufficiently dominant pole in both FL(s) and FH(s). To be dominant, there must be no other poles or zeros between that pole and the midband. This means that the dominant pole is the highest frequency pole in FL(s) and the lowest frequency pole in FH(s). Remember that FL(s) and FH(s) are two separate transfer functions that are handled separately - purely for convenience in order to reduce the number of terms that must be dealt with at any one time - and so each function has its own dominant pole. And don't overlook the fact that the dominant pole must be dominant over the zeros as well as the other poles in order for this method to work well.
In order for this method to yield accurate results, the dominant pole must be sufficiently dominant or "dominant enough" in order to dictate the frequency response in its vicinity. Usually, this is satisfied if the other poles and zeros are at least two octaves (a factor of four) and preferably a decade (a factor of ten) further away from the midband than is the dominant pole. For example, in the case of FL(s), a pole at p might be sufficiently dominant if the nearest pole or zero is at a frequency no higher than p/4. Likewise, in the case of FH(s), a pole might be sufficiently dominant if the nearest pole or zero is at a frequency no lower than 4p.
Keep in mind that this Rule of Thumb regarding what constitutes a sufficiently dominant pole is intended to be applicable to the bulk of circuit configurations where you are dealing with only a few (say less than five or six) poles and most of the non-dominant poles are located orders of magnitude away from the dominant pole. In this case, the dominant pole is only being influenced (to any significant degree) by one or two relatively nearby poles. The more poles there are and, especially, the more poles there are that are "relatively close" to the dominant pole, the "more dominant" the dominant pole needs to be in order to "sufficiently dominant" to serve as a good approximation for the cutoff frequencies.
Low Frequency Response:
Let's look at the equation for FL(s) a little more closely:
The assumption we are making is that one of the poles is dominant relative to all of the other poles and zeros. Since we are talking about the low frequency response, that means that the dominant pole will be greater in magnitude than all of the other poles or zeros. Remember that we ordered the poles and zeros such that the dominant pole is p1. This means that, in the case of the low frequency response, p1 is the pole with the highest frequency. Also recall that, to be dominant, the dominant pole has to dominant over all of the zeros as well. In other words, p1 is the highest frequency of any of the poles or zeros in FL(s).
Let's multiply out the denominator one term at a time and see what we can learn about its structure:
![]()
Adding the next term we get:
![]()
![]()
The pattern that is developing reveals the following:
If we complete the expansion and factor out sNL we get the following:
![]()
with the di coefficients defined as:
A treatment of the numerator follows an identical path with the end result being the following form for FL(s):
with the gi coefficients defined as:
Notice that, since the number of poles must equal the number of zeros in FL(s), the factors of sNL cancel out from both the numerator and denominator.
By way of example, let's examine the terms in the denominator of FL(s) for case of NL=3 a little more closely:
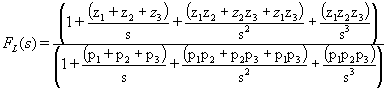
Remember that we are assuming (requiring) that p1 is "sufficiently dominant" and is therefore much greater than all of the other poles and zeros. For, for illustrative purposes, let's assume that p1 is ten times as large as p2, that all of the higher order poles are also equal to p1/10, and that all of the zeros are equal to zero. The above equation then becomes:
Now, the frequency that we are interested in is the point at which FL(s) begins to drop as we come down in frequency. In particular, we would like to find the frequency at which FL(s) is reduced by 3dB. If there was only a single pole, p1, then clearly this would occur at p1. As we add additional poles below p1, the actual point at which FL(s) begins to drop is going to be at a frequency slightly different than p1.
If we solve the above equation for the actual 3dB point, we discover that it is at a frequency of 1.02p1. Keep in mind that d1 is the frequency corresponding to the sum of all of the pole frequencies. If p1 is sufficiently dominant, then d1 is going to be about equal to p1.
The demominator of FL(s) term is dominated by d1 (the sum of the poles) and the remaining terms have relatively little effect. Studying how we got to this point should convince you that the more dominant that p1 is, the less of an effect that the other poles have and that adding more non-dominant poles really doesn't change this much. Also keep in mind that, even if the zeros are not located at zero frequency, our conditions state that the dominant pole is dominant over ALL of the zeros. This means that, for frequencies at or above p1, the low frequency transfer function looks approximately like:
You should recognize this as a first order high pass filter with a 3 dB cutoff frequency located at d1 where d1 is simply the sum of all of the pole frequencies and where d1 is going to be located at a frequency near and slightly higher than p1, the most dominant pole. Keep in mind that d1 is NOT the true cutoff frequency, it is only an estimate of it. The more dominant that p1 is, the better the estimate. Also recognize the bottom line - IF we can find d1 (or even just p1) then we have found an estimate of the lower cutoff frequency. It turns out that there is a straightforward way to systematically analyze the circuit and find d1 exactly. We shall return to that shortly.
Turning out attention to the upper cutoff frequency, we can follow a very similar development:
High Frequency Response:
Let's look at the equation for F_H(s) a little more closely:
F_H(s) = [1+(s/z1))(1+(s/z2))(1+(s/z3))...(1+(s/zNH))] / [(1+(s/p1))(1+(s/p2))(1+(s/p3))...(1+(s/pMH))] with MH >= NH
The assumption we are making is that one of the poles is dominant relative to all of the other poles and zeros. Since we are now talking about the high frequency response, that means that the dominant pole will be lower in magnitude than all of the other poles. Let's assume that we have ordered the poles and zeros from lowest frequency to highest frequency such that p1 is the dominant pole. This means that:
p1 << p2 <= p3 <= p4 <= ... <= pNH
and also that
p1 << z1 <= z2 <= z3 <= ... <= zMH
Let's multiply out the denominator one term at a time and see what we can learn about its structure:
(1 + s/p1)(1 + s/p2) = 1+ [(1/p1) + (1/p2)]s + [(1/p1)*(1/p2)]s^2
(1 + s/p1)(1 + s/p2)(1 + s/p3) = 1 + [(1/p1) + (1/p2)]s + [(1/p1)*(1/p2)]s^2 + (1/p3)s+ (1/p3)*[(1/p1) + (1/p2)]s^2 + [(1/p1)*(1/p2)*(1/p3)]s^3
= 1 + [(1/p1) + (1/p2) + (1/p3)]s + [(1/(p1*p2))+(1/(p1*p3))+(1/(p2*p3))]s^2 + [(1/p1)*(1/p2)*(1/p3)]s^3
The pattern that is developing reveals that if we write the complete expansion in the form:
[(1+(s/p1))(1+(s/p2))(1+(s/p3))...(1+(s/pMH))] = 1 + e1*s + e2*s^2 + ... + eMH*s^NH
we have the following:
e1 = (1/p1) + (1/p2) + (1/p3) +...+ (1/pMH). The term e1 is therefore the sum of the reciprocals of all the poles. Another way of phrasing this is that e1 is the sum of the time constants associated with each pole.
eMH = 1/(p1*p2*p3*...*pMH). The term eMH is therefore the reciprocal of the product of all the poles. Another way of phrasing this is that eMH is the product of all of the time constants associated with each pole.
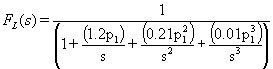
e2 through e(NH-1) is a mixture of sums and products with the key feature being that the number of poles in the products is always less than NH. Let's examine the terms shown above for NH=3 a little more closely:
1 + [(1/p1) + (1/p2) + (1/p3)]s + [(1/(p1*p2))+(1/(p1*p3))+(1/(p2*p3))]s^2 + [(1/p1)*(1/p2)*(1/p3)]s^3
Remember that we are assuming that p1 is much smaller than all of the other poles. Let's, for illustrative purposes, assume that p1 is one tenth as large as p2 and that all of the higher order poles are equal to p2. The above equation then becomes:
1 + (1.2/p1)s + (0.21/p1^2)s^2 + (0.01/p1^3)s^3
In a manner analogous to F_L(s), the frequency that we are primarily interested in is the point at which F_H(s) begins to start dropping as we go up in frequency. If there was only a single pole, p1, then clearly this would occur at p1. As we add additional poles above p1, the actual point at which F_H(s) begins to drop is going to be at a frequency lower than p1. So let's examine the above equation at s=(1/e1)=(p1/1.2). Keep in mind that (1/e1) is the fequency corresponding to the sum of all of the time constants for all of the pole frequencies. If p1 is sufficiently dominant, then (1/e1) is going to be about equal to p1.
1 + 1 + (0.175) + (0.083)
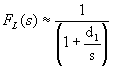
This term is dominated by e1 and the remaining terms have little effect. As before, studying how we got to this point should convince you that the more dominant that p1 is, the less of an effect that the other poles have and that adding more non-dominant poles really doesn't change this much. Therefore, near (and below) the upper cutoff frequency the denominator is approximately equal to:
(1 + e1*s)
We can do the exact same thing with the numerator and conclude that, for frequencies at or below p1, it is about equal to:
(1 + m1*s)
Where m1 is the sum of the time constants for each of the zeros. However, note that our conditions state that p1 is dominant over ALL of the zeros. This means that, even if the zeros are all at the same frequency and are at a frequency of about 10*p1, that the above equation will be approximately equal to 1 for frequencies below (1/e1). The means that, if p1 is truly a sufficiently dominant pole, that our high frequency transfer function, in the vicinity of the upper cutoff frequency, is about equal to:
F_H(s) ~= 1 / ( 1 + e1*s)
You should recognize this as a first order low pass filter with a 3 dB cutoff frequency located at (1/e1) where, again, e1 is simply the sum of time constants of all of the pole frequencies and where (1/e1) is going to be located at a frequency near and slightly lower than p1, the most dominant pole in F_H(s). Keep in mind that (1/e1) is NOT the true cutoff frequency, it is only an estimate of it. The more dominant that p1 is, the better the estimate. Also recognize the bottom line - IF we can find (1/e1) (or even just p1) then we have found an estimate of the upper cutoff frequency.
Development of Open Circuit and Short Circuit Resistance Methods:
Well, all of this is fine and good, but how does it help us. The claim was that this was leading to a method that would allow us to determine an estimate of the cutoff frequency without going though the complete analysis of a high-ordered (multi-poled) circuit. That is where we are now. Let's review what we want and what we know:
We want to know the lower cutoff frequency (or a reasonable estimate of it) for a circuit that exhibits a bandpass behavior and that is characterized by a dominant pole in both stopbands.
We know that we can split the overall transfer function into three parts - a low frequency part, a midband part and a high frequency part.
We know that, for most circuits, we can associate the external capacitors with the low frequency part and the internal capacitors with the high frequency part.
We know that we can draw three different circuits - one for each region of interest. In the midband the internal capacitors look like opens while the external capacitors look like shorts. At frequencies below midband the internal capacitors look like opens but we must deal with the external capacitors. At frequencies above the midband the external capacitors look like shorts but we must deal with the external capacitors.
We know that, if the dominant pole in the low frequency transfer function is sufficiently dominant, that the transfer function approximates a first order behavior in the vicinity of the dominant pole and that a good estimate of the cutoff frequency is the sum of the frequencies associated with each pole and that this frequency will be close to the frequency of the dominant pole.
We know that, if the dominant pole in the high frequency transfer function is sufficiently dominant, that the transfer function approximates a first order behavior in the vicinity of the dominant pole and that a good estimate of the cutoff frequency is the reciprocal of the sum of the reciprocals of the frequencies associated with each pole and that this frequency will be close to the frequency of the dominant pole.
With all of this in mind - particularly the last two points - we can take the next step. We are assuming that each transfer function (the low frequency and the high frequency) is characterized by a dominant pole. We know that the number of poles in the circuit is equal to the the number of capacitors in the circuit. We can't really claim that each capacitor is associated with one of the poles - the interactions are generally much more complex than that. But we can say that, because of the presence of a dominant pole, it is not unreasonable to claim that, at the cutoff frequency, only one capacitor is playing a major role. We make this claim because the transfer function is behaving like a first order (i.e., single capacitor) circuit in that vicinity.
It is therefore not unreasonable to claim that, at the cutoff frequency, all of the other capacitors are not playing a major roll. In the case of the lower cutoff frequency, this means that at the cutoff frequency one of the external capacitors is behaving like a capacitor but the operating frequency is sufficiently high that all of the other external capacitors are behaving like short circuits. Similarly, in the case of the upper cutoff frequency, this means that at the cutoff frequency one of the internal capacitors is behaving like a capacitor but the operating frequency is sufficiently low that all of the other capacitors are behaving like open circuits.
This opens an avenue to find the frequency of the dominant pole which, by itself, is a reasonable estimate for the cutoff frequency. We don't know which capacitor determines the dominant pole, so we work through them all determining what the cutoff frequency would be if it were the right capacitor. We will therefore build up a list of frequencies - one for the external capacitors and one for the internal capacitors. It will become obvious which of these frequencies is dominant and we will get a good idea of whether it is sufficiently dominant compared to the others. To get the frequency associated with each capacitor, we simply determine the resistance seen by the capacitor under the appropriate conditions and the product of that resistance and the capacitance will yield a time constant that can be converted directly into a frequency.
The "appropriate conditions" are simply those described above and summarized below:
If you are looking for the lower cutoff frequency, you open all of the internal capacitors (since you are operating at a frequency well below any at which they come into play) and you go through the circuit for each of the external capacitors determining the resistance it would see if all of the other external capacitors were shorted (since, if the capacitor in question were to be the dominant capacitor the operating frequency is well above where the others come into play). This resistance is referred to as the short circuit resistance seen by that capacitor.
If you are looking for the upper cutoff frequency, you short all of the external capacitors (since you are operating at a frequency well above any at which they come into play) and you go through the circuit for each of the internal capacitors determining the resistance it would see if all of the other internal capacitors were opened (since, if the capacitor in question were to be the dominant capacitor the operating frequency is well below where the others come into play). This resistance is referred to as the open circuit resistance seen by that capacitor.
The above analysis might show that, while a dominant pole did exist, it was not highly dominant (say by at least a factor of ten) compared to the other poles. If we could determine a value for d1 (in the case of F_L(s)) or (1/e1) (in the case of F_H(s)) then we would have a much better estimate of the corresponding cutoff frequency. It turns out that we already have all of the information we need to determine d1 and (1/e1) exactly, though we must still keep in mind that they are still only approximations to the actual cutoff frequencies and are still subject to the existence of a sufficiently dominant pole. However, they are much better approximations than simply the frequency associated with the dominant capacitor - especially in the case where the dominant capacitor is not overwhelmingly dominant.
The proof of the following results is beyond the scope of this discussion. However, a summary of the results so far should convince you that they are not unreasonable:
Lower Cutoff Frequency Using Short Circuit Resistances
We saw above that, in the case of a very dominant pole in F_L(s), the lower cutoff frequency (which we will call omega_L) is approximately equal to the frequency of the dominant pole:
omega_L ~= p1
We also saw that the frequency associated with a sufficiently dominant pole in F_L(s) can be estimated using the Short Circuit Resistance seen by the dominant capacitor.
omega_L ~= 1/(R1s*C1) (where the dominant capacitor has been assigned an index of 1)
Hence, in the case of a very dominant pole,
p1 ~= 1/(R1s*C1)
Furthermore, in the vicinity the lower cutoff frequency, F_L(s) has the following behavior:
F_L(s) ~= s/(s+d1)
where d1 is the sum of all of the pole frequencies and is approximately equal to p1 if p1 is sufficiently dominant. A better approximation for the lower cutoff frequency would be:
omega_L ~= d1 = p1+p2+p3+...+pNL
Just as p1 has a frequency 1/(R1s*C1) associated with it, each of the remaining poles also as a frequency associated with it - namely the frequency determined by the capacitance and the short circuit resistance seen by that capacitance. Therefore, without proof, the following result is offered:
omega_L ~= d1 = SUM {i = 1 to NL} [1/(Ris*Ci)]
It turns out that the above equation for d1 is exact, although this does not change the fact that d1 is still only an approximation for omega_L.
Upper Cutoff Frequency Using Open Circuit Resistances
We saw above that, in the case of a very dominant pole in F_H(s), the upper cutoff frequency (which we will call omega_H) is approximately equal to the frequency of the dominant pole:
omega_H ~= p1
We also saw that the frequency associated with a sufficiently dominant pole in F_H(s) can be estimated using the Open Circuit Resistance seen by the dominant capacitor.
omega_H ~= 1/(R1o*C1) (where the dominant capacitor has been assigned an index of 1)
Hence, in the case of a very dominant pole,
p1 ~= 1/(R1o*C1)
Furthermore, in the vicinity the lower cutoff frequency, F_L(s) has the following behavior:
F_L(s) ~= 1/(1+e1*s)
where e1 is the sum of all of the time constants of the pole frequencies and (1/e1) is approximately equal to p1 if p1 is sufficiently dominant. A better approximation for the lower cutoff frequency would be:
omega_H ~= (1/e1) = 1 / [(1/p1)+(1/p2)+(1/p3)+...+(1/pMH)]
Just as p1 has a frequency 1/(R1o*C1) associated with it, each of the remaining poles also as a frequency associated with it - namely the frequency determined by the capacitance and the open circuit resistance seen by that capacitance. Therefore, without proof, the following result is offered:
omega_H ~= (1/e1) = 1 / [ SUM {i = 1 to MH} [(Ris*Ci)] ]
Note that this makes e1 = SUM {i = 1 to MH} [(Ris*Ci)]
It turns out that the above equation for e1 is exact, although this does not change the fact that (1/e1) is still only an approximation for omega_H.
A Word of Caution
It needs to be understood that the "frequencies" associated with each of the capacitors as a result of the above analyses are NOT the pole frequencies of the transfer function. It would be wonderful if they were since this would provide a simple yet very powerful means of building up the entire transfer function one pole at a time. Furthermore, if this were the case, the proof of the above results would be trivially simple - as it is someone probably received their PhD for deriving these results. These frequencies are purely mathematical constructs that, when put together as described above and under the appropriate conditions of a sufficiently dominant pole, allow us to get a very useful estimate for two of the actual pole frequencies of the transfer function - namely the upper and lower limits of the passband. Do not be lulled into reading more into this technique than is actually there.